Week 7: Database (Assignment 9)

| Friday 19 August 2011
The task that we required to do for this week is creating a simple database for student management information using OpenOffice Base.

1) Open OpenOffice Base
2) Create a new database> No, do not register the database>Finish
Main OpenOffice window


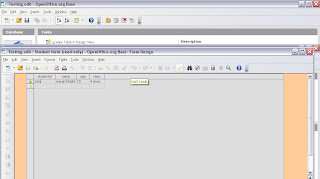
3) Click on Table> Create Table in Design View.


4) Click on the first row and type in 'Student ID' and make it as a primary by clicking at the green arrow in the first column. Insert other required information.
5) Click File> Save As> Student table/ any appropriate name.


6) Go to OpenOffice window, right-click on one of the Table that you have created and click 'Form Wizard'


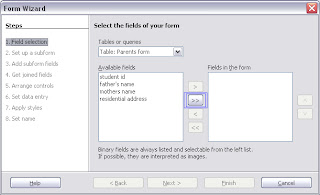
7) Click on the >> button, like shown in above left screencaps, another window like the left one will appear, fill student's detail and Save Record.
8) Click Queries> Use Wizard to Create Query, transfer all available fields into fields in the query. Starting with student form and then parents from, leave student id in parent form in available field.FINISH
9) Click Report> Use wizard to create report, transfer all available field and you'll get an outcome like this


Finish! to me right now, every assignment is like a hill., and unfortunately I'm a fat kid who are force to climb it.  I know i'll reap the benefit, lose fat, become healthier, stronger, and more active but it's very tiring because I have some carry  a tonnes of brick while climbing. In reality, it's too much considering that we have assignment with exam around the corner. Other than that, I'm glad I've completed it, and another one waiting to be finished

Read more »

Week 6: Student Score & Grade Analysis (Assignment 8b)

| Thursday 18 August 2011
The task for this week are:-

a.       Plan, create and edit a simple one year personal financial management (income and spending) spreadsheet using Calc .
b.      Plan, create and edit a spreadsheet of students score and grade analysis

Spreadsheet of Student Score & Grade Analysis

      I can barely remember the last time I use Microsoft Excel, in Form 4 when I have to do my statistical assignment for Add. Math. In short, I have no idea how to use Microsoft Excel. I can't even make out the instruction in the tutorial, But after our lecturer show and guide us on how to in excel, and the help from my classmates, I successfully complete the task albeit taking a long time.

VLOOKUP - grade of the score.

Diagram 1

1) Highlight the grade table, Change to an appropriate name (i.e. grade)


3) Click on the first column under grade (in this case: C2) and then click  function button


4) fx > All > VLOOKUP

5) Lookup_value : Click on the the first column filled with mark (in my case B2, take a look at diagram 1)
    Table_array: Fill in the name of you grade table earlier ( Ref. 1st step)
    Col_index_num: 2
    Range_lookup: Leave it blank
    Click OK
6) The grade of the marks will appear in C2 column. Next click the column an put the arrow at the edge of the box, click and drag until the last column, the grade will automatically appear.

STDEV - the average of marks


1) click on a column (as shown on the picture above), type appropriate name for standard deviation. Click fx   
    button."Insert function" box will appear, then OK.


2) Click on the first column of the score until the last column, OK

Note: For average score, use the same step for standard deviation except choosing "AVERAGE' in "Insert Function" box.

COUNTIF - calculate how many students for each grade


1) Fill in a few column like shown in above picture.
2) Click on COUNTIF in "Insert Function" box, OK


3) Range: The grade column
    Criteria: the grade the you want to find out.
4) OK

GRAPH

1) Highlight the data to be converted to graph
2) Insert>Column

It is a tedious work, mind where you click and the column that you use, the reason why the formula/calculation is messed up is like ly because of them. But still, it's good to know how to make student grade analysis. It's beneficial for future use. Although, by the time i have to use it. memory will fail me, I can look it up in this entry.

Read more »

Week 6: Personal Financial Management (Assignment 8a)

| Wednesday 17 August 2011


The task for this week are:-

a.       Plan, create and edit a simple one year personal financial management (income and spending) spreadsheet using Calc .
b.      Plan, create and edit a spreadsheet of students score and grade analysis


Personal Financial Management


Personal financial management using Calc. I doubt I'll be using this in near future. But it will be useful, say if i
have to do budget for certain event or activities. The task is easier than the other one. Probably because the
simple nature of adding and subtracting the amount, plus the automatic calculation (after you set it up) make
calculating easier all around.

As you can see in the picture above, income is written on the same column.

1) When you want to add the values say in this case, income+previous month balance.


2) Click on the column that you want the sum to appear, type = B3(income/first value)+ B4 (Previous Month Balance/ second value) and ENTER.


Note: The same steps can be applied to subtracting operation, just change the add symbol to minus.
Read more »

Week 6: Presentation Kit and Multimedia Courseware (Assigment 7a and 7b)

| Monday 15 August 2011
This task is certainly not easy but I'm glad I've played a lot with editing software, be it picture, audio or video. However , thinking I barely scratch the surface, make me scratch my heads. How am I going to do this?, do I click this? Should I just try this and feeling like banging my head against the wall when I had to start anew when things go wrong. Alas, I've made it.

Some part of my video comes from youtube, there's a need to convert it from flv to wmv. Therefore, a video converter is needed. Well, for free software we can always go to Cnet download, because there are tons of software for download there. Fortunately, I found a light weight software - obviously a choice influence by internet condition in this place.


 The rest of the video was edited with Windows Movie Maker, the help feature was very helpful, it's easier when there is a task pane at the left side of it.

For the sounds, i need to record my voice, so naturally using my phone the extension would be amr which cannot be detected by Powerpoint. Therefore I use Fast AMR M4A ACC WAV MP3 WMA Audio Converter, which is so made easy by its user friendly interface, the only downside it's a trial version and can only convert one file at a time because it's trial version. Anyhow, here's the screen capture.


Read more »

Week 5: Brochures & Bookfold (Assignment 6a and 6b)

| Sunday 14 August 2011


The assignment for this week is making a brochures and bookfolds. Dividing task with my patner, I have to do brochures on the topic that we've studied before; web 2.0. I spent the whole night for the brochures concept like the main colours, the content and the accessory to beautify the brochures, alas later that night, I got the hang of it.

The task is tedious but interesting as time goes, what people should know, how to explain web 2.0 concept. Remembering that according to the survey very little people know about the term web 2.0 although lots of them use it, I decided the definition should be inserted.  After, mulling over it for a while, definition best be clear and concise, elaboration may needed but too much of that may make the introduction art looks like an essay. What we need is for the readers to get the gist of it before they lose interest.

Next question is how to make them understand the concept, therefore instead of writing a paragraph on example, we give them visual representation - using facebook screen capture and show the readers, which element make Facebook Web 2.0 so that readers can see vividly the characteristics of a Web 2.0 website and able to analyse it themselves.

 In this week, we're also required to create a booklet using bookfold function in Word, Of coure it is a new idea, I don't even know that this function exist before.

It was a gratifying process, it is good getaway from boring dreary writing task. I'm able to learn more about microsoft publisher, found out what we need to have in brochures so that people get the idea of the content we are delivering and others.


Read more »

Week 4: SPSS and Qualitative Analysis

| Wednesday 10 August 2011
The task for this week is related to statistic and analysis, in correlation of what we have done last week. and we already have the result for our survey at googledocs. Thanks to all the participants.


However as stated in the task question, only simple survey can use googledoc and survey monkey, for a more detail survey, we should use SPSS for the analysis.

Here's the result of survey Web 2.0; Distance Learning

Read more »

Week 3b: Survey & Online Questionaire

| Thursday 28 July 2011
Credits to SurveyMonkey


For this task we're required to produce a ten question survey at Surveymonkey. The sign up part is a breeze but creating the question was gruelling, our question was rejected each time we went to our lecturer (actually two times) but the second time we went to the lecturer some of our questions still does not make to the cut. There are lots of error. At some point , i just want to formulate some question and be done with it. But thinking that we'll be using the analysis for our next assignment, we're back to work seriously on the questionnaire

Anyway, according our lecturer, the questions in survey must be related in some ways, at least the data from the next question can be used to back up, the data that have been collected earlier. For instance, if the first question is asking the participants to rate their own computer competency, the next question will be asking about what activities they have done on the internet, because some participants may rate their skill as poor but they manage their own blog well and have knowledge on HTML codes and other related skill. This 'back up' question can be used as evidence for the surveyor to prove or analysing the participants' computer skills.

Apart from that, the wording of the question give huge impact on what we want to know. If we want to test their knowledge, what they have (facilities) and others. Thus it is very import to use the correct word to gain the relevant answer from the participants. The answering scheme also affect the data, rating scale, multiple answers and one answer only. Some of the questions may need to have 'others(state)' feature added to it, but some do not. It irrelevant to add others to question asking 'what is your gender?' when the answer is outright yes or no, even androgynous has their eminent or inclination to be former or latter.

It's is utmost important that the participants take the questionnaire/ survey seriously, if not the data will be implicated, thus the data will be corrupted. As a result the analysis will be too. It will cause wrong information to be spread to the masses.
Read more »
 

Copyright © 2010 Nurul Salma | Design by Dzignine