The task for this week are:-
a. Plan, create and edit a simple one year personal financial management (income and spending) spreadsheet using Calc .
b. Plan, create and edit a spreadsheet of students score and grade analysis
Spreadsheet of Student Score & Grade Analysis
I can barely remember the last time I use Microsoft Excel, in Form 4 when I have to do my statistical assignment for Add. Math. In short, I have no idea how to use Microsoft Excel. I can't even make out the instruction in the tutorial, But after our lecturer show and guide us on how to in excel, and the help from my classmates, I successfully complete the task albeit taking a long time.
VLOOKUP - grade of the score.
 |
| Diagram 1 |
1) Highlight the grade table, Change to an appropriate name (i.e. grade)

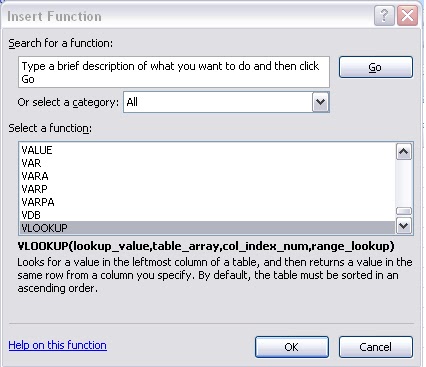
4) fx > All > VLOOKUP

5) Lookup_value : Click on the the first column filled with mark (in my case B2, take a look at diagram 1)
Table_array: Fill in the name of you grade table earlier ( Ref. 1st step)
Col_index_num: 2
Range_lookup: Leave it blank
Click OK
6) The grade of the marks will appear in C2 column. Next click the column an put the arrow at the edge of the box, click and drag until the last column, the grade will automatically appear.
STDEV - the average of marks

1) click on a column (as shown on the picture above), type appropriate name for standard deviation. Click fx
button."Insert function" box will appear, then OK.

2) Click on the first column of the score until the last column, OK
Note: For average score, use the same step for standard deviation except choosing "AVERAGE' in "Insert Function" box.
COUNTIF - calculate how many students for each grade

1) Fill in a few column like shown in above picture.
2) Click on COUNTIF in "Insert Function" box, OK

3) Range: The grade column
Criteria: the grade the you want to find out.
4) OK
GRAPH
1) Highlight the data to be converted to graph
2) Insert>Column

It is a tedious work, mind where you click and the column that you use, the reason why the formula/calculation is messed up is like ly because of them. But still, it's good to know how to make student grade analysis. It's beneficial for future use. Although, by the time i have to use it. memory will fail me, I can look it up in this entry.


0 comments:
Post a Comment